Technical Indicators
What Is a Technical Indicator?
A technical indicator is a mathematical calculation signal based on historic price or volume
Types of Technical Indicators
- Trend Indicators
- Simple Moving Average (SMA)
- Exponential Moving Average (EMA)
- Moving Average Convergence/Divergence (MACD)
- Average Directional Movement Index (ADX)
-
Momentum Indicators
- Stochastic Oscillator, Relative Strength Index (RSI)
-
Volume Indicators
- On Balance Volume (OBV)
- Money Flow Index (MFI)
-
Volatility Indicators
- Bollinger Bands
-
Support and Resistance Indicator
- Fibonacci Retracements
1. Trend Indicators
Simple Moving Average (SMA)
This is the easiest moving average to construct. It is calculated as the average price over the specified period. The average is called “moving” because it is plotted on the chart bar by bar, forming a line that moves along the chart as the average value changes.
• If the SMA is positively sloping, the trend is up.
• If the SMA is negatively sloping, the trend is down.
Determine trend duration
• 200-bar SMAs are common proxies for long-term trends.
• 50-bar SMAs are typically used to gauge intermediate trends.
• Shorter-period SMAs can be used to determine short-term trends.
Determine trading signals via price crosses
• When prices cross above the SMA, you may want to go long
or cover short.
• When prices cross below the SMA, you may want to go short
or exit long
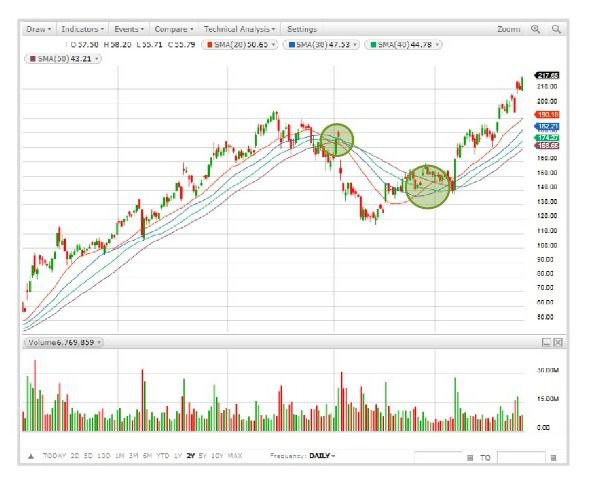
Using moving average crossovers to generate trading signals When a more sensitive (faster) SMA crosses above a less sensitive (slower) SMA from below, it is considered bullish. When a more sensitive (faster) SMA crosses below a less sensitive (slower) SMA from above, it is considered bearish.
Exponential Moving Average (EMA)
The EMA measures trend direction over a period of time. It applies more weight to data that is more current. Because of its unique calculation, EMA will follow prices more closely than a corresponding SMA
• Use the same rules that apply to SMAs when interpreting EMAs.
Keep in mind that EMAs are generally more sensitive to nearer-term
price movement.
Determine trend direction
• When the EMA rises, you may want to consider buying when prices
dip near or just below the EMA. When the EMA falls, you may
consider selling when prices rally toward or just above the EMA.
Indicate support and resistance areas
• A rising EMA tends to support the price action, while a falling EMA
tends to provide resistance to price action.
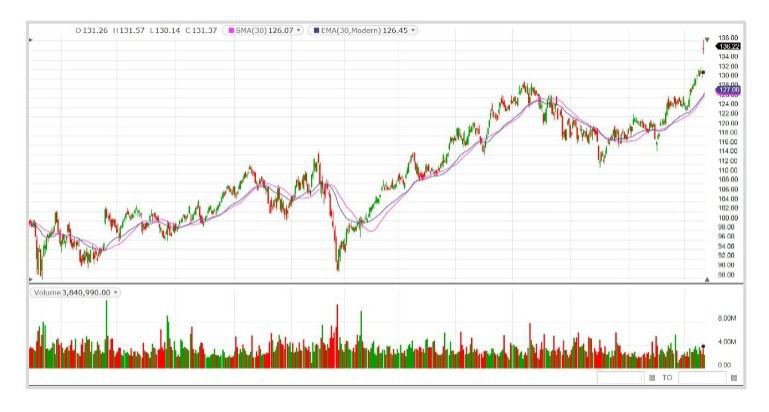
Both the EMA and the SMA here represent 30 days. EMA reacts faster to the first pullback and the subsequent rally.
Moving Average Convergence/ Divergence (MACD)
• MACD crossing above the zero line is considered bullish, while
crossing below the zero line is bearish. When MACD turns up from
below the zero line, it is considered bullish. When it turns down from
above the zero line, it is considered bearish.
• When the MACD line crosses from below to above the signal line,
the indicator is considered bullish. The further below the zero line
this cross occurs, the stronger the signal.
• When the MACD line crosses from above to below the signal line,
the indicator is considered bearish. The further above the zero line
this cross occurs, the stronger the signa
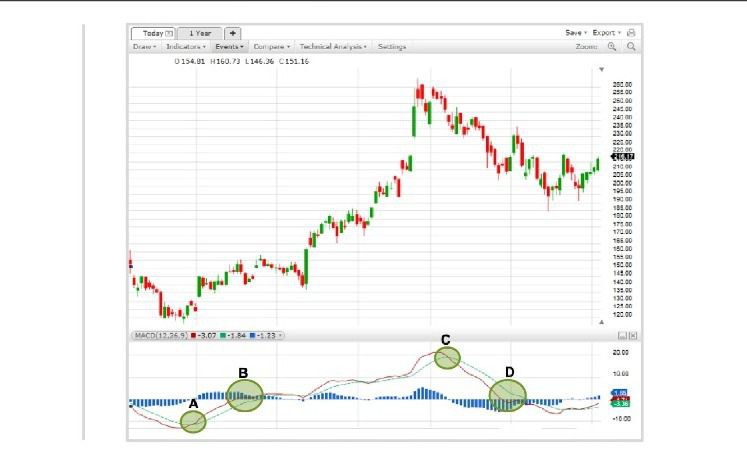
A. Bullish B. Bullish C. Bearish D. Bearish
2. Momentum Indicators
• In bounded indicators, also called “oscillators,”
a limit exists as to how high or low they can reach.
• When the oscillator reaches a zone close to its
highest bound, it is called “overbought.”
• When it reaches a zone close to its lowest bound,
it is called “oversold.”
• An oscillator value in these zones indicate that
the market is vulnerable to reversal. A signal
often occurs when the oscillator exits one of
these zones
• In some cases, the reaching of extreme levels
indicates that a new trend has begun. In these
instances, the oscillator will remain in a zone for
the period of the trend and will give many false
signals on corrections to the trend.
• The interpretation of oscillator oversold
and overbought is thus dependent on the
underlying trend.
• They don’t work when a trend is strong, but excel
in trading range markets.
Stochastic Oscillator
Determine exit and entry
• Generally, the area above 80 indicates an overbought region, while
the area below 20 is considered an oversold region.
• A sell signal is given when the oscillator is above the 80 level and
then crosses back below 80. Conversely, a buy signal is given when
the oscillator is below 20 and then crosses back above 20.
• A crossover signal occurs when the two lines cross in the overbought
or oversold region.
• Divergences form when a new high or low in price is not confirmed
by the Stochastic Oscillator.
Relative Strength Index (RSI)
Determine the speed and change of price
• The RSI oscillates from zero and 100. Traditionally, the RSI is
considered overbought when above 70 and oversold when below 30.
• In an uptrend or bull market, the RSI tends to remain in the 40-90
range with the 40-50 zone acting as support.
• During a downtrend or bear market, the RSI tends to stay in the
10-60 range with the 50-60 zone acting as resistance.
• If underlying prices make a new high or low that isn't confirmed by
the RSI, this divergence can signal a price reversal.
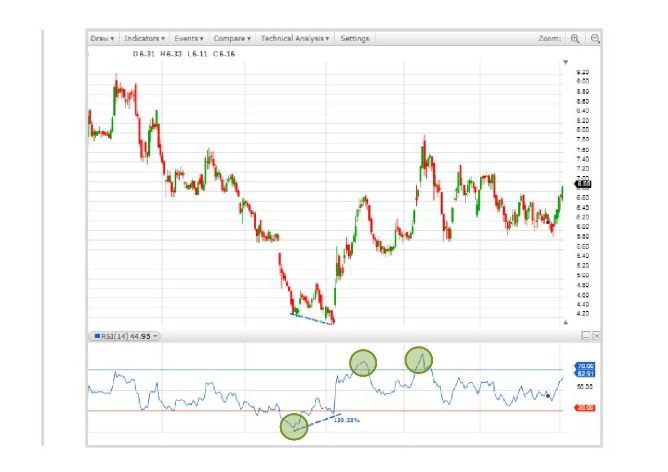
Overbought and oversold signals on the chart indicate price movement in the short term. Also bullish divergence can be spotted
3.Volume Indicators
General Volume Theory
ncreasing volume reinforces the trend direction. Declining volume diminishes the trend direction. A price peak or trough on ultrahigh volume is often an important reversal point in a trend. Volume indicators should be considered warnings but not signals of change in trend direction
On Balance Volume (OBV)
On Balance
Volume (OBV)
OBV measures buying and
selling pressure as a cumulative
indicator that adds volume on
up days and subtracts volume
on down days
• The actual value of the OBV is unimportant; concentrate on its
direction.
• When price continues to make higher peaks and OBV fails to make
higher peaks, the upward trend is likely to stall or fail. This is called a
negative divergence.
• When price continues to make lower troughs and OBV fails to make
lower troughs, the downward trend is likely to stall or fail. This is
called a positive divergence.
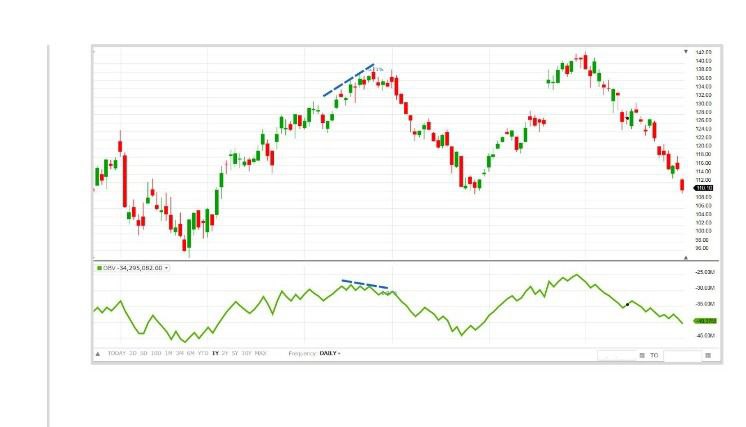
Bearish divergence: OBV is confirming the higher peaks in price, which preceded the selloff
Money Flow Index
MFI is a volume indicator that
measures the flow of money
into and out of a security over a
specified period of time. It is
related to the Relative Strength
Index (RSI) but incorporates
volume, whereas the RSI only
considers price
• Oversold levels typically occur below 20 and overbought levels
typically occur above 80. These levels may change depending on
market conditions.
• Oversold or overbought levels are generally not reason enough to
buy or sell and traders should consider additional technical analysis
or research to confirm the security's turning point.
• If the underlying price makes a new high or low that isn't confirmed
by the MFI, this divergence can signal a price reversal.
4. Volatility Indicators
Bollinger Bands
Bollinger Bands are a type of
price envelope plotted at a
standard deviation level above
and below a Simple Moving
Average of the price. Bollinger
Bands help determine whether
prices are high or low on a
relative basis.
Determine relative price
• When the bands tighten during a period of low volatility, it raises the
likelihood of a sharp price move in either direction.
• When the bands separate by an unusually large amount, volatility
increases and any existing trend may be ending.
• Use swings within the band’s envelopes to help identify potential
profit targets
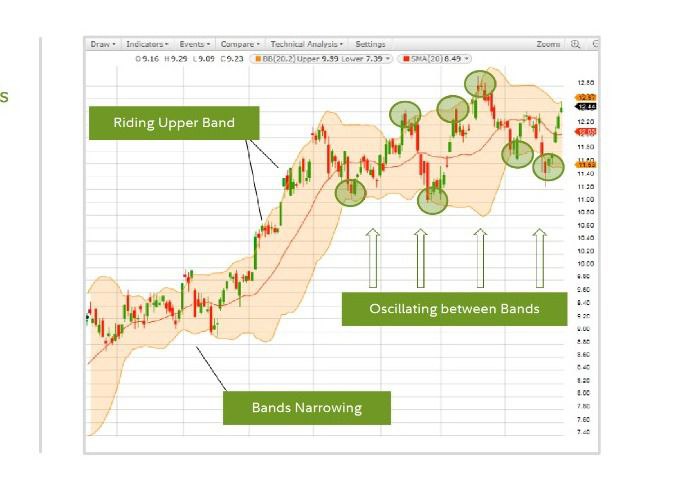
Riding Upper Band Oscillating between Bands Bands Narrowing, Acting as Psuedo support and resistance
5. Riding Upper Band Oscillating between Bands Bands Narrowing
Plot percentage retracement
lines based on the
mathematical relationship
within the Fibonacci sequence.
These retracement levels
provide support and resistance
levels that can be used to target
price objectives.
Provide support and resistance levels
• Applying these percentages to the difference between the high and
low price for the period selected creates a set of price objectives.
• Depending on the direction of the market, up or down, prices will
often retrace a significant portion of the previous trend before
resuming the move in the original direction.
• These countertrend moves tend to fall into certain parameters, which
are often the Fibonacci Retracement levels.
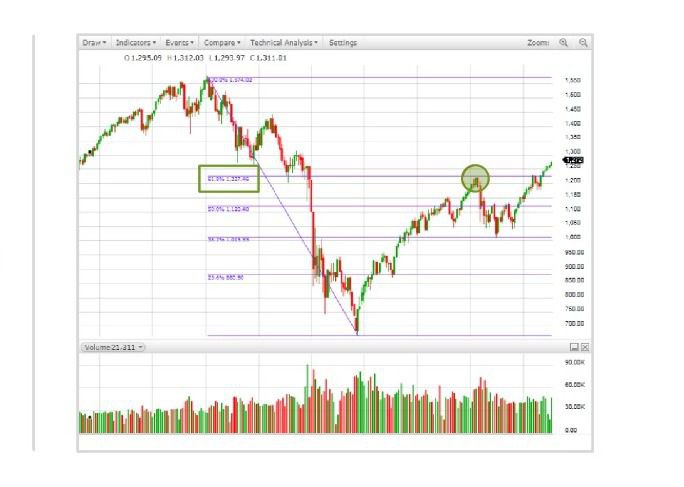
Here, we have drawn a down sloping Fibonacci Retracement line from the absolute peak to the absolute trough to determine levels of resistance we may meet.
In this example, the first major correction occurred at 61.8% retracement